The COMMAND Center™ Concrete software comes complete with a wide array of reporting options for concrete professionals. While all the reports are straightforward and easy to use, users (especially those newer to the system) can sometimes lose track of all the powerful options available to them. Let’s explore how reports are generated and what’s available to users.
The COMMAND Center Concrete 4 iOS app makes reporting on concrete projects simple. Within the app, users create Projects and, within each project, Placements. For each placement created, users then enter placement-specific specifications and add Sensors to enable chart creation and report generation for those sensors. Note: Reports only pertain to the sensors in each selected placement.
Once projects are set up, project owners can share them with other users and define permission levels (i.e., Full or Limited access). Full Access users get complete access to all placements and underlying placement information. Limited Access users can view the data, but can’t share the project with others, add/edit placements or specifications, or generate reports.
After opening a placement, Full Access users will see a report icon. ![]()
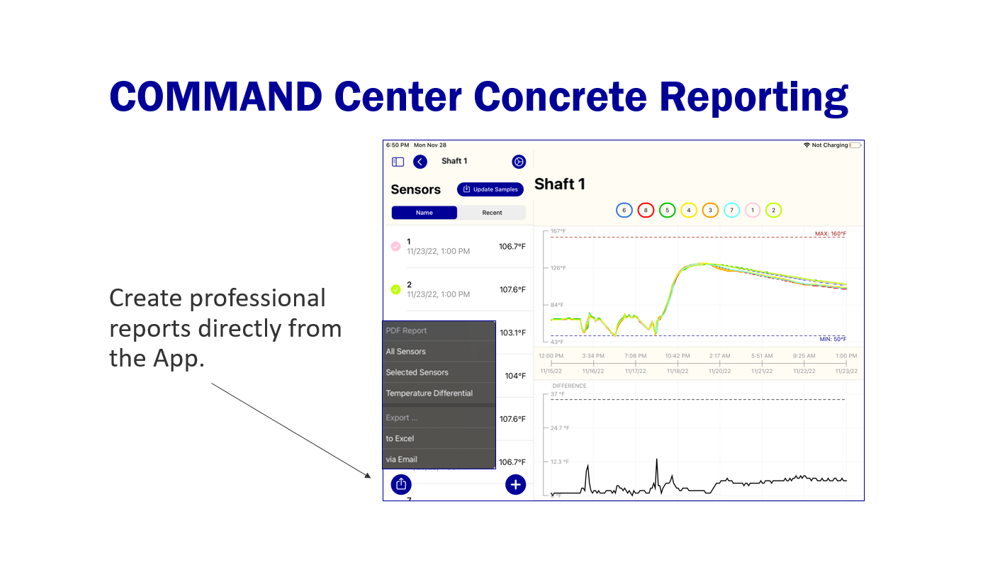
Selecting this icon displays a menu of report options. Under the PDF Report heading, options for an All Sensors report, a Selected Sensors report, and a Temperature Differential report are listed. And under the Export heading, options for to Excel and via Email are listed.
It’s important to understand the difference between the All Sensors and Selected Sensors PDF reports. The All Sensors report is always active as long as there are sensors in the placement, no matter if a sensor is selected or not. This option generates a PDF report that presents individual information for each sensor in tables and charts. The Selected Sensors report option is active once a sensor is selected, and generates a PDF with similar information, including data from all selected sensors combined on a single chart.
Like the Selected Sensors report, the Temperature Differential report becomes active and may be generated when two or more sensors are selected. This report provides temperature differential data and sensor-specific data in tables and also includes the charts that graph temperature history and temperature differential as seen in the app.
Found under the Export heading, an Excel report can also be generated by tapping to Excel and will include all the raw data from your sensors, but will not include charts and preconstructed tables that itemize individual sensor information. An Excel report is comprised of one workbook for the entire placement and individual worksheet tabs for each sensor that contain some basic information about each sensor and the data points that were collected.
The via Email option rolls all information for the entire placement into a single PC2 file that can then be attached to an email and opened and used in the COMMAND Center Windows software. This PC2 file, however, does not sync with the COMMAND Center Cloud and will not receive new data after it’s generated. Like our app, the COMMAND Center for Windows software enables users to create PDF reports and Excel reports.
The Reports and Support You Need
A wide range of construction professionals – including owners, project managers, engineers, consultants, technicians, and others – rely on reports generated by the COMMAND Center Concrete system. If you have questions about how to generate the right report for the right audience, our support professionals are always here to help.

